Uruguay‘s primary activities grew 10.9% y-o-y in 1H2022, driven mainly by increased rice, meat and soybean production.
Uruguay’s real GDP increased 8.0% in the six months ended June 30, 2022, compared to the same period in 2021.
Above all, this increase in real GDP was driven by increases in all sectors of the economy (with the exception of public administration activities), which recovered following the impact of the Covid-19 pandemic during the first half of 2021, despite a slowdown as a result of global inflationary and recessionary concerns and uncertainty surrounding the Ukraine–Russia war.
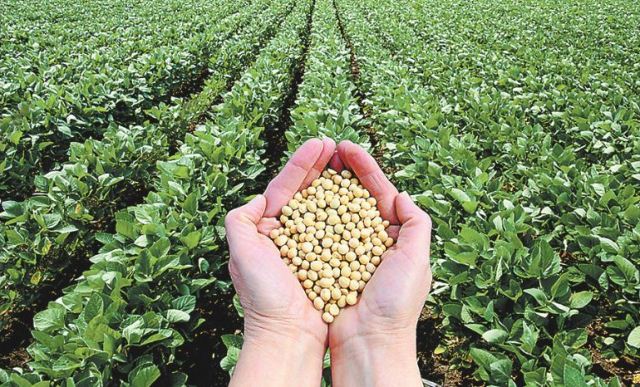
Soybean production
The primary activities sector includes agriculture, livestock, fishing and mining. Uruguay’s territory consists mainly of vast plains which, together with its temperate climate, make the country very suitable for agriculture and livestock farming.
Globally, Uruguay ranked as the sixth largest soybean exporter in 2021.
That year, its shipments reached a customs value of US$897 million, with a 19% year-on-year increase.
On the other hand, the manufacturing sector grew 4.2% in the first half of 2022, driven by higher external demand for meat, as well as increased production of syrups, concentrates, automobiles and fiberboard.
In contrast, primary activities contracted 5.4% in 2020 compared to 2019, mainly due to a decline in soybean production.
However, this decline was partially offset by the good performance of winter crops, higher demand for lumber, and an increase in milk collection.
In 2021, the primary sector rebounded with growth of 5.0%.
The rise was the result of increases in livestock, forestry, and grain and oilseed production, although it was partially limited by a drop in fishing.
That same year, wheat and milled rice exports fell 18.5% compared to 2020.
In contrast, exports of agricultural products (28.2%), processed meats (57.4%), leather goods (61.4%), pulp and paper (42.5%) and motor vehicles (72.1%) grew.
On the import side, Uruguay recorded an increase of 36.4% in 2021 compared to 2020.
Of this total, 28.8% corresponded to consumer goods, 56.1% to intermediate goods and 15.1% to capital goods.