In 2021, the top five container exporters, accounting for nearly half of the traffic, were China, the United States, Vietnam, the Republic of Korea and Japan.
China alone accounted for about 30%, according to UNCTAD data.
In the United States, the boom in the trans-Pacific route reflected the impact of stimulus spending.
Global containerized trade, 1996-2021 (million 20-foot equivalent units and percentage annual change)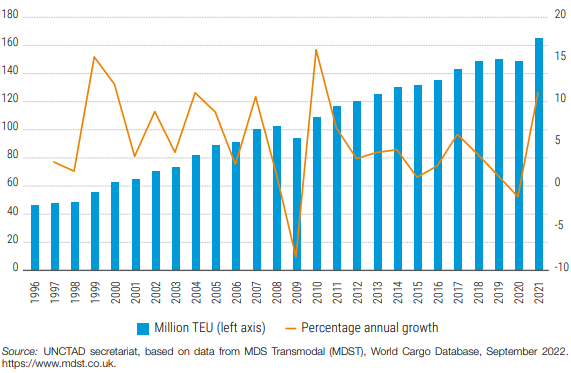
About 40% of total containerized trade was on the major East-West routes, between Asia, Europe and the United States.
Non-major East-West routes, such as South Asia-Mediterranean, accounted for 12.9 percent, while South-South trade, such as from Sub-Saharan Africa to Latin America and the Caribbean, accounted for 12.5 percent, and North-South, such as from Africa to Europe, 7.8 percent.
Container exporters in the world
In Asia, which is at the center of global manufacturing, parts and components of goods cross borders several times and contribute to 27 percent of global containerized trade flows, equivalent to the combined share of East-West, South-South and non-major North-South flows. Other routes account for the remainder.
Also, according to UNCTAD, non-major East-West routes, such as South Asia-Mediterranean, accounted for 12.9%, while South-South trade, such as Sub-Saharan Africa to Latin America and the Caribbean, accounted for 12.5%, and North-South, such as Africa to Europe, accounted for 7.8%.
Overall, containerized trade performed well in 2021, driven by pandemic-driven demand for consumer goods, especially from East Asia.
Volume, which had declined 1.3% in 2020, rebounded in 2021, reaching 165 million 20-foot equivalent units (TEUs).
This was driven by improving global economic conditions, coupled with the release of pent-up demand, inventory replenishment and continued spending on consumer goods, increasingly through e-commerce.
In 2021, all of these routes recovered, with stronger performance in the core East-West and non-core East-West and South-South routes.
Trade on non-core East-West routes increased 10.5%, a positive result despite a second wave of Covid-19 in South Asia during the second quarter of 2021.
Intra-Asian flows dominated this trade, as the region is at the center of global manufacturing, where parts and components of goods cross borders multiple times.