World exports of agricultural products more than tripled between 1995 and 2019, from $ 446 billion in 1995 to $ 1.459 billion in 2019, according to WTO data.
The share of agricultural products in total merchandise exports decreased from 8.9% in 1995 to 7.9% in 2019. The decrease is the result of the fact that trade in non-agricultural products has increased more sharply during this period.
While Europe accounted for half of world agricultural exports in 1995, its share fell to 43% in 2019. North America and the Middle East also lost share of exports. The regions that experienced increased participation were Asia, Central and South America, Africa and the CIS.
The United States was the top exporter and importer of agricultural products in 2019. China’s share of world imports nearly quadrupled between 1995 and 2019.
Brazil was the main net exporter of agricultural exports in 2019, with a trade surplus of $ 71.5 billion. China was the top net importer in 2019, while in 1995 it was a net exporter.
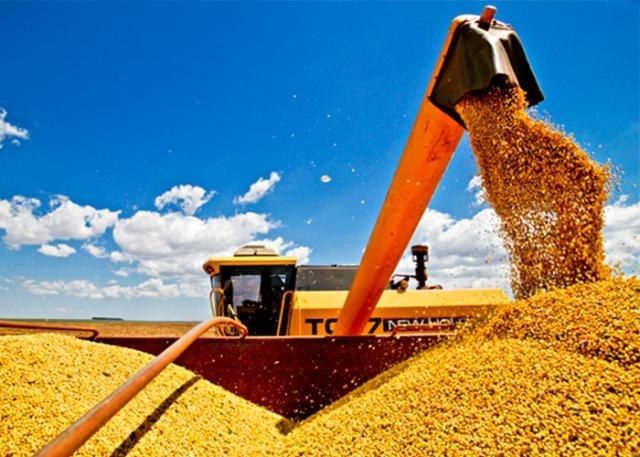
Agricultural products
Soybeans were the most imported agricultural product in 2019, with a share of 4.3% of total world agricultural imports; in 1995, soybeans ranked 13. In 1995, coffee had been the most imported product, with a 3.7% share. It fell to 10th place in 2019.
In 2019, food prices were 24% above their respective 1995 level. On average, they increased 0.9% per year during this period.
World trade of agricultural products, 1995-2019
In 2015, 61% of the value-added content of world exports of agricultural products originated from the agricultural industry itself, while 39% was obtained from other industries located upstream in the production chain. The service industry represented 23% of the added value, mainly distribution and commercial services. Another 12% came from the manufacturing industry.
![]()