
Top U.S. fruit exports to Canada and Mexico
The volume of U.S. fresh, dried, and processed fruit exports between 2012/13 and 2021/22 fell 29%, to 2.9 million metric tons, according to USDA data.
However, a 25% increase in unit value during this period softened the decline in value to just 11% lower, as trade fell $0.7 billion, to $6.0 billion.
One factor contributing to the lower export volumes was the contraction in production of most major export commodities.
However, this was partially offset by increased exports to Canada and Mexico, due to the U.S. advantage as a border country that transports perishables, as well as differences in growing seasons between the U.S. and other countries that supply these markets.
In the 2021/22 season, the main U.S. fruit markets were Canada, Mexico, South Korea, and Japan, and the main products were apples, grapes, strawberries, oranges, and cherries.
Fruit exports
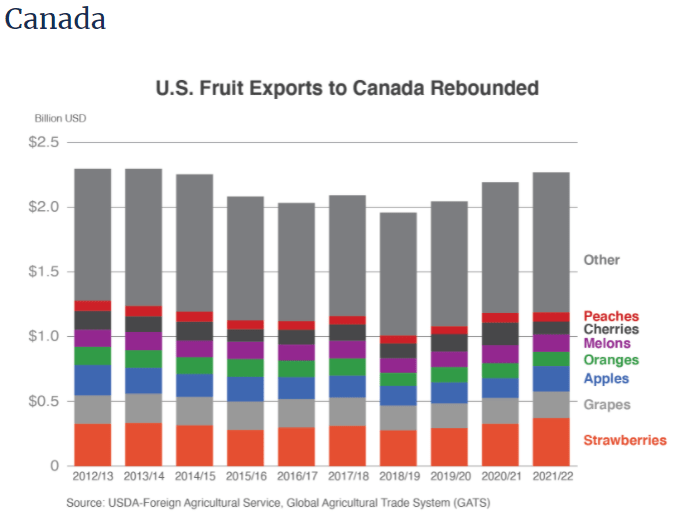
Over the past 10 years, U.S. exports to Canada declined for several years before rebounding to finish nearly flat at $2.3 billion.
In the 2021/22 cycle, the top products were strawberries ($371 million), grapes ($206 million) and apples ($196 million).
Canada was the leading U.S. market for strawberries and grapes and the second for apples.
In particular, the value of strawberry exports increased 13 percent over the last 10 years, but this was due to unit value increasing by almost 40 percent, while volume decreased 18 percent.
Exportable supply was reduced by a 13% decline in U.S. production.
In addition, competition from Mexico during this period reduced U.S. market share from 91% to 84%, as Mexico increased exports during its peak shipping months of December through February, a period of reduced shipments from the United States.
Other sales to Canada
Grape exports decreased 6% in value and 10% in volume over the last decade, with a slight increase in unit value.
Exports occur mainly between July and November and face limited competition from Mexico, Chile and Peru, because most shipments from these countries arrive outside this period due to different growing seasons.
Finally, apple export volume increased 6 percent over the last 10 years, but suffered a 16 percent decline in value, as unit value fell 21 percent.
Export volume was boosted by increased production. The United States increased its market share slightly during this period, to 84%, at the expense of Chile and New Zealand.
Mexican market
U.S. exports to Mexico over the past 10 years increased nearly $200 million to $936 million, most of which occurred over the past two years in strong apple shipments.
In the 2021/22 season, the top products were apples ($343 million), grapes ($118 million) and pears ($86 million).
Mexico was the leading U.S. market for apples and pears and the second largest for grapes.
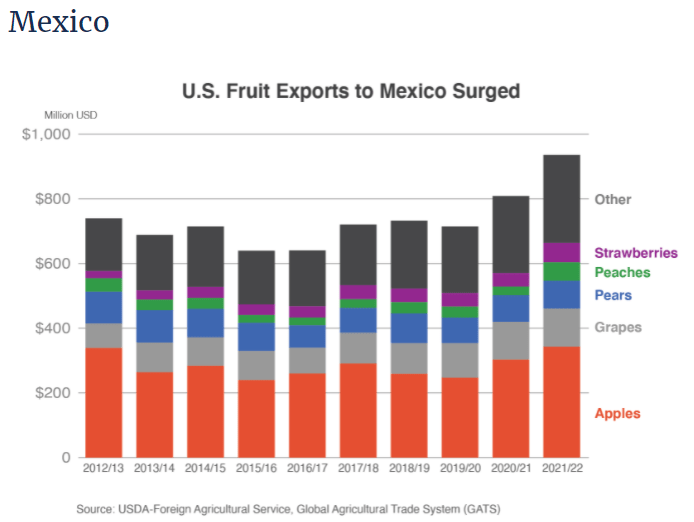
Specifically, apple export volume increased 7% over the last 10 years, but only 1% in value, as unit value fell 5%. The United States had over 96% market share, with limited competition from Chile.
At the same time, grape exports increased by more than 50% in volume and value, with a marginal increase in unit value. Exports occur mainly between July and December and face limited competition from Chile and Peru due to different growing seasons.
The volume and value of pear exports declined by 18% and 12%, respectively, but the decline was somewhat offset by a 7% increase in unit value.
Over the past decade, increased competition reduced U.S. market share from 96% to 87% as Argentina increased exports during its peak shipping months of May through August, a period of reduced shipments from the United States.
![]()